TL; DR
For events monitoring you can use this ready-to-go elastic + kibana + k8s-event-exporter stack from : k8s-events-reporting
The premise
As part of an internal project at Dell, I needed to measure the time between the different PVC and PV states (Pending, Bound, Mounted, etc.) through their lifecycles.
For example, how long it takes for a PVC to be bounded to is volume? The same question between a volume request and mounted to a Pod.
The idea is to measure the performance of our different drivers (csi-powermax, csi-isilon, csi-vxflexos, csi-powerstore) in various scenarios (e.g. one pod needs one hundred volumes, one hundred pods writing to the same volume, evaluate the impact of the volume size, etc.).
The PV/PVC/Pod status is available with kubectl get pv,pvc,po and you can track the lifecycle through Kubernetes events with kubectl get events.
How to get the events?
A simple search on kubernetes and monitoring will return tons of resources from open-source or proprietary projects to collect metrics and logs from Kubernetes. Unfortunately, they mostly focus on metrics collection and container logs.
For my little project, I just needed to get the details of the events.
My first idea was to dump the events kubectl get events -A -o json and load them somewhere like SQLite or excel. Being a nerd, I think we can do better.
The Kubernetes events reporting stack is composed of :
- kubernetes-event-exporter for the event collection
- elasticsearch for the database
- kibana for the reporting engine
kubernetes-event-exporter
This utility developed by OpsGenie will basically dump the events and forward them to different destinations (sink in their terminology). It has extra features like filtering the type of events or choose the fields you want to forward.
The deployment of that component has been tweaked and templatized in a helm chart like the rest of the stack.
The magic to connect that component to elasticsearch will be discussed in the dedicated post for ConfigMap and Secrets.
ElasticSearch & Kibana
The rest of the stack uses well-known components from Elastic. The deployment uses the Elastic Cloud on Kubernetes.
Thanks to the operator framework, we can very easily configure and deploy a secured version of ElasticSearch and Kibana. This is done by the install.sh with :
kubectl apply -f https://download.elastic.co/downloads/eck/1.1.1/all-in-one.yaml
After you run and successful launch the install.sh and your stack is ready ; you can load the kibana dashboard with :
curl -X POST "localhost:5601/api/kibana/dashboards/import?exclude=index-pattern" -H 'Content-Type: application/json' -d @kibana-dashboard.json
Of course, you have to adjust the URL & credentials; the result will look like this :
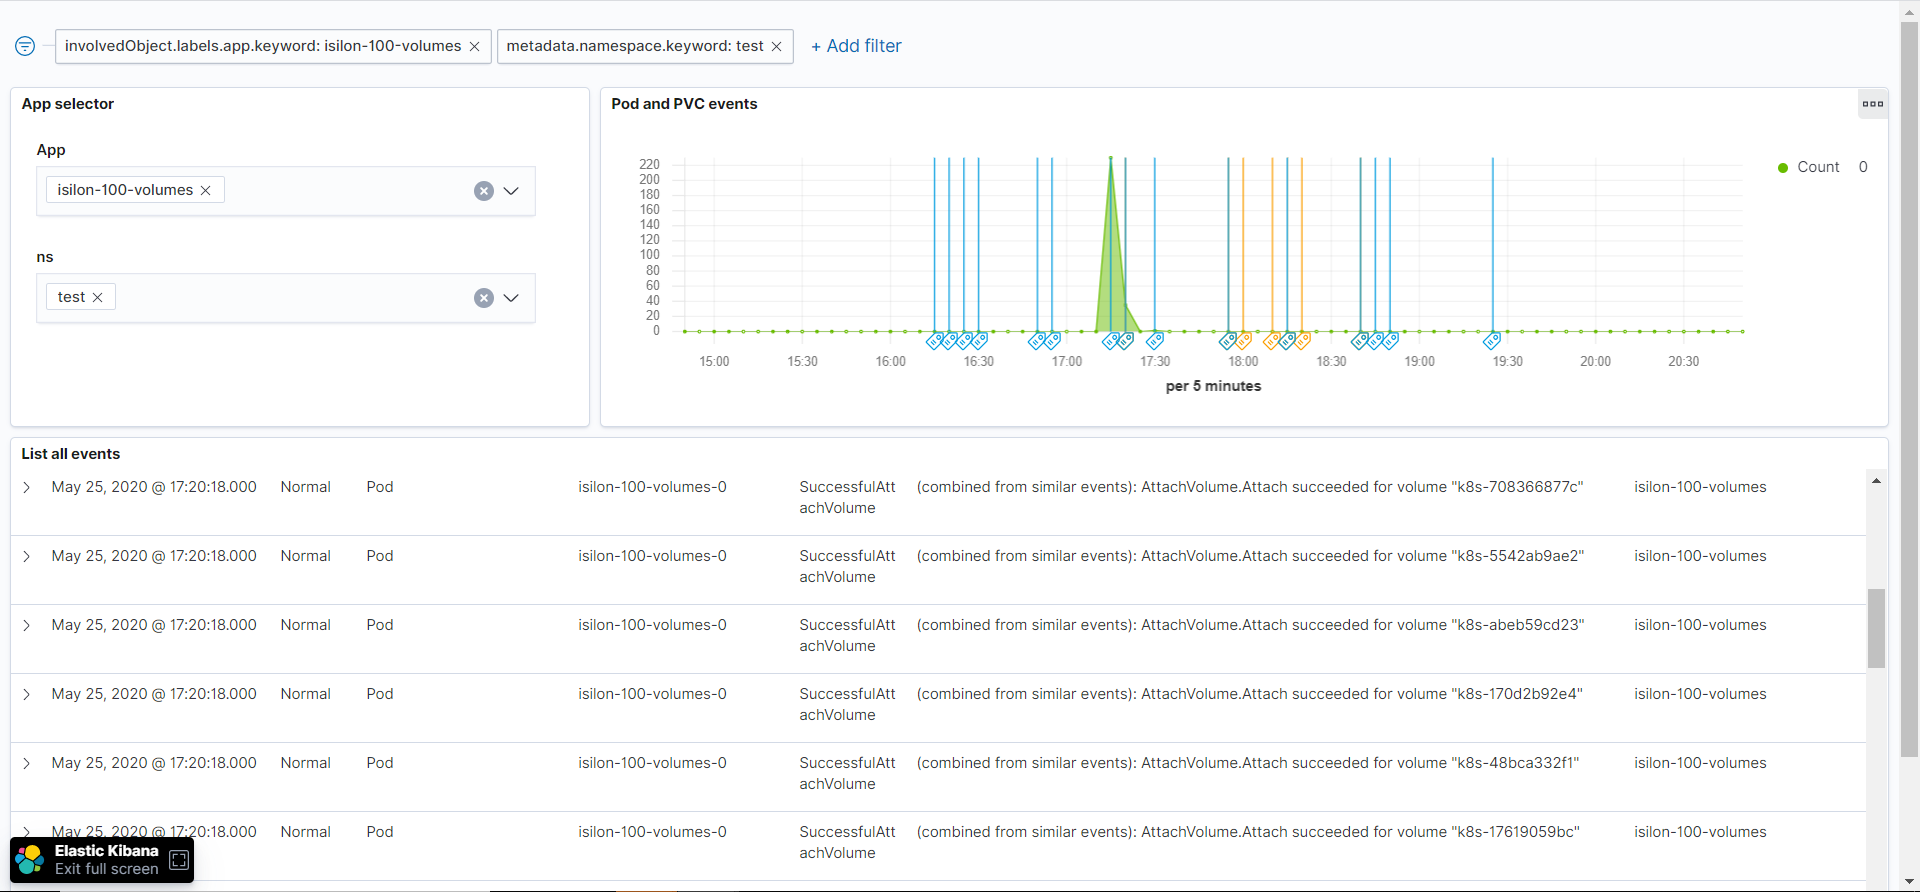
From now on, you can visualize the kubernetes events and keep them longer than the 1-hour default in your cluster. The provided dashboard is PV/PVC/Pods centric but any events are collected so you can tweak and hack the Kibana dashboard ;-)
Wrap-up
That Kubernetes events monitoring stack have been used and tested for one-shot statistics and analytics. Nevertheless, the component and approach can fit other use-cases like observability, alerting, and monitoring.
There is more to say about the kubernetes-even-exporter configuration in the context of Kubernetes. It will be addressed in more detail in the ConfigMap and Secrets post.